FOOD HOLIDAY: U.S. Coffee Drinking Statistics For National Coffee Day | The Nibble Webzine Of Food Adventures - The Nibble Webzine Of Food AdventuresFOOD HOLIDAY: U.S. Coffee Drinking Statistics For National Coffee Day | The Nibble Webzine Of Food Adventures
How about a cup or two of coffee drinking statistics for National Coffee Day, September 29th? This survey was conducted in July by Live Science.
For starters, about 83% of adults drink coffee in the U.S., the world’s largest consumer of coffee, up from 78% a year earlier, according to the National Coffee Association’s 2013 online survey. That’s an average of three cups a day per person, or 587 million cups.
Who’s Drinking Coffee & When
Total number of U.S. daily coffee drinkers: 100 million
Americans over the age of 18 who drink coffee every day: 54%
Percentage of U.S. coffee drinkers who claim to need a cup of coffee to start their day: 60%
Percentage of coffee drinkers who have a cup within the first hour of waking up: 68%
Percentage of coffee consumption that takes place during breakfast hours: 65%
Percentage of coffee consumed between meals: 30%
Percentage of coffee drinkers who drink 13 or more cups of coffee each week: 24%
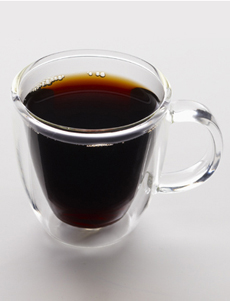
Thirty-five percent of Americans drink their coffee black. Photo courtesy Coffee Bean & Tea Leaf.
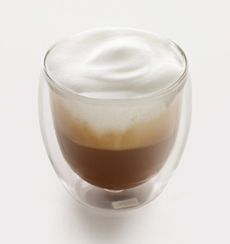
Thirty million Americans drink a cappuccino, latte, mocha or other specialty drink. Photo courtesy Coffee Bean & Tea Leaf. Thermal glass cup from Bodum.
How Americans Drink It
Percentage of coffee drinkers who prefer their coffee black: 35%
Percentage of coffee drinkers who add cream and/or sugar: 65%
Number of daily coffee drinkers who drink specialty beverages (lattes, cappuccinos, mochas, etc.): 30 million
Percent of coffee drinkers who go to premium places (Starbucks, Coffee Bean) when they get coffee: 34%
Percent of people who go to lower-price outlets (McDonalds, Dunkin Donuts, etc.) when they get coffee: 29%
What Do We Pay For Our Coffee?
Average price of an espresso-based drink: $2.45
Average price for cup of brewed coffee: $1.38
Total average of money spent on coffee each year by coffee drinker: $164.71
Total amount of yearly money spent on specialty coffee in the U.S.: $18 billion